Last time in "Unveiling the Mirage of Economic Robustness," we started peeling back the layers of economic data that often go unquestioned. We probed the glossy surface that policymakers tend to present, asking — is our economy as strong as the numbers suggest?
Today, we're going deeper. In Episode 2: "Behind the Economic Veil," we're decoding the real story behind GDP and inflation numbers. We’ve been told that recent GDP data signals a robust U.S. economy, but a closer look suggests we might be celebrating too soon. Are we mistaking a mirage for an oasis?
With 2024 on the horizon and economic forecasts growing grimmer, understanding these indicators is more than academic — it's essential for foreseeing the challenges ahead.
We’ll dissect the real versus nominal growth rates and what they herald for the economic weather forecast. Could we be heading into a storm despite what the policymakers' barometer reads?
Stay tuned as we chart the course of our financial fate, and make sense of the economic winds that are picking up speed.
The Inflation Adjustment: Real vs. Nominal GDP The charts we've seen underscore inflation's significant role in shaping GDP, delineating the stark contrast between nominal and real figures. The pivotal GDP deflator, whose annual rate changes are captured in Table 6, reveals much about these adjustments.
The Misleading Measures of Economic Health
Our policymakers' favored economic gauges often lead them astray, as they rely on quarterly GDP releases and inflation indices, fostering a cycle of misguided policy decisions. This critical misstep is further exemplified by Table 7, where we observe the deflator's marked variance over the last five years and the past four quarters.
Table 7 - For the last 5 years the deflator is ~ 23% & over the last 4 quarters, just over 3%:
Seasonal Adjustments and Their Minimal Impact
Over time, as shown in Table 8, seasonal adjustments seem to have a negligible effect on the real GDP, raising questions about the methods we employ to gauge economic health.
Table 8 - Over time seasonal adjustments make little difference to real GDP:
The Discrepancies in GDP Growth
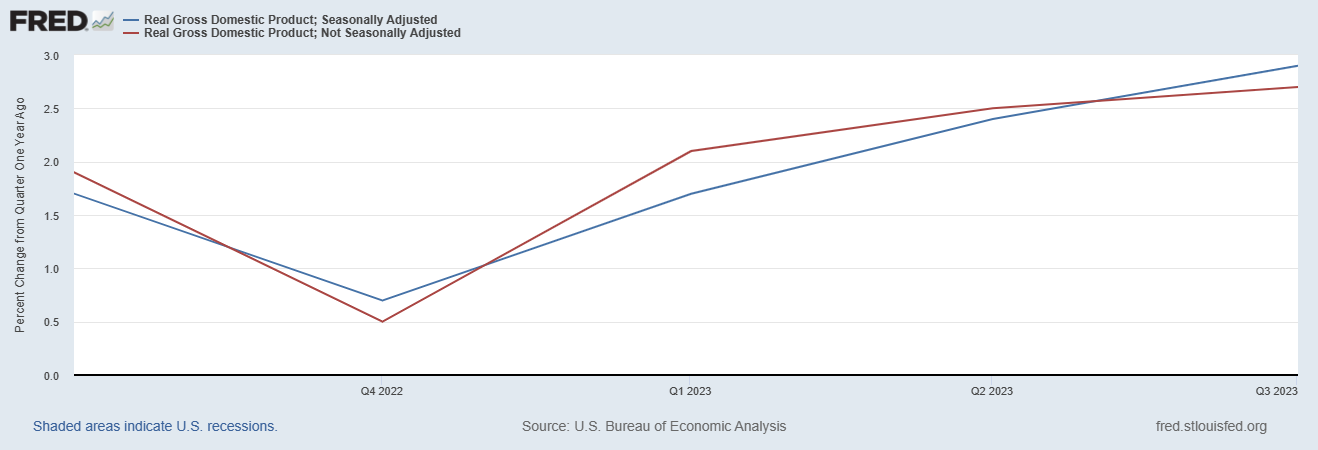
The growth of seasonally adjusted real GDP, almost 3% in the last four quarters, contrasts with the unadjusted rate closer to 2.5%, as seen in Table 9. This divergence, especially post-pandemic, is indicative of underlying economic turbulence.
Table 9 -Seasonally adjusted real GDP has grown at almost 3% in the last 4 quarters whereas unadjusted is closer to 2.5%, a divergence that developed during/after the pandemic.[1]
PCE vs. CPI: A Broader Economic Model
When it comes to policy considerations, the Fed's preference for Personal Consumer Expenditures (PCE) over the Consumer Price Index (CPI) is notable, with Table 10 presenting a broader economic model to gauge inflation.
Table 10 – For policy considerations the Fed uses Personal Consumer Expenditures (PCE), not Consumer Price Index (CPI), to gauge inflation. CPI aims to measure changes in a basket that supposedly represents household expenditure. PCE is purportedly a broader economic model:
The GDP Deflator's Proximity to PCE
Table 11 demonstrates how the GDP deflator has closely tracked the PCE rather than the CPI, offering insights into the varying measures of inflation and their implications.
Table 11 shows how the GDP deflator has tracked closer to PCE than to seasonally adjusted or unadjusted Consumer Price Index (CPI) over the last 5 years:
Divergence in Inflation Measures
The last year has seen the GDP deflator align more closely with the lower CPI, diverging from the typically higher PCE, as detailed in Table 12. This has significant implications for perceived real GDP growth.
Table 12 shows that in the last 12 months however, PCE has been the higher measure but that the GDP deflator has instead, diverged from PCE and instead has, since April, almost exactly matched the lower CPI reading (thereby overstating Real GDP growth):
Understanding the Rate of Inflation Change
Both PCE and CPI provide a cumulative perspective on inflation, but the rate of change of these measures, as displayed in Table 13, serves as a better indicator of current economic direction.
Table 13 shows the seasonally adjusted and unadjusted trimmed mean PCE rate:
The Inflation Rate's Decline
The sharp decline in the inflation rate, detailed in Table 14, over the past year highlights the dynamic nature of economic fluctuations and their impact on policy.
Table 14 shows just how sharply the inflation rate has fallen over the past year and year-to-date:
Interest Rates and Their Long-Term Impact
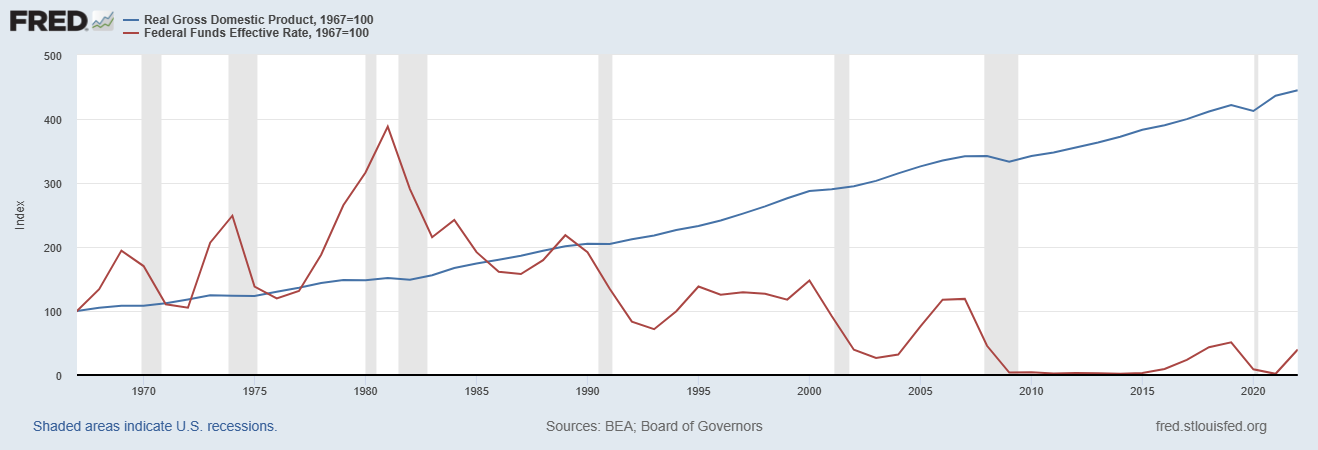
Table 15 delves into the primary policy response to inflation—interest rates—and their apparent minimal long-term impact on real GDP.
Table 15 shows the main policy interest rate (the Federal Funds Rate [FFR], red line),which over the long-term seems to have had little impact on cumulative Real GDP (blue):
Interest Rates Preceding Economic Downturns
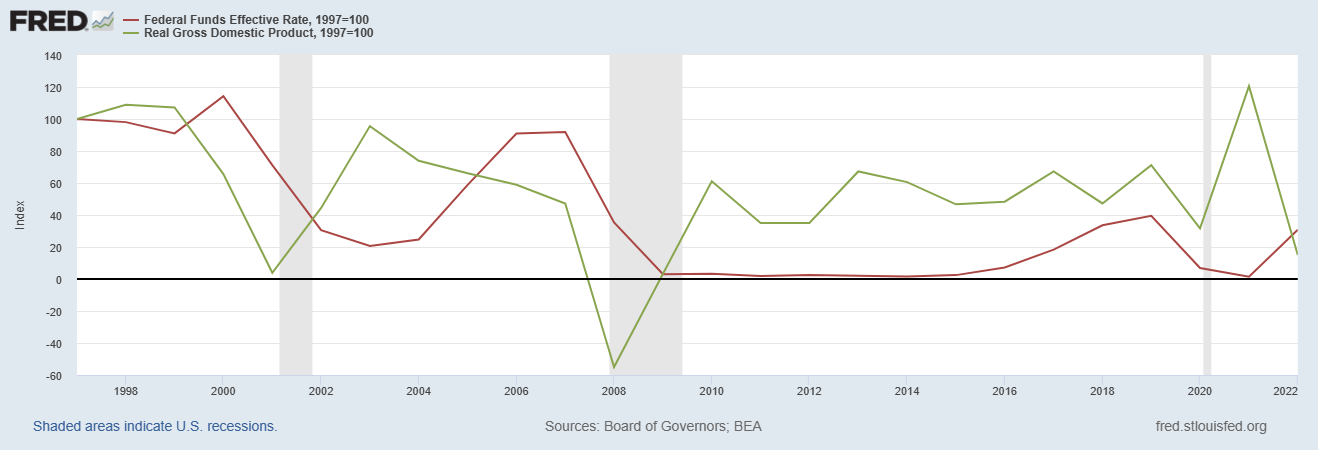
Taking a closer look at Table 16 reveals that rising interest rates have historically preceded declines in GDP growth rates, with significant downturns’ often leading to recessions.
Table 16 - However, it’s worth taking a closer look at the preceding chart and in particular, the grey shaded areas, which denote recessions (i.e. contraction in economic activity). If we also look at the rate of change in Real GDP (green line) a consistent picture emerges:
A Consistent Picture of Recession
Precursors The three recessions of the last quarter-century, as shown in Table 17, illuminate the consistent pattern of interest rate increases preceding economic slowdowns.
Table 17, which shows the 3 recessions of the last 25 years:
Summary: A Look Back to Forecast Ahead
In 1999, Real GDP peaked at almost exactly the time that the FOMC embarked on rate hikes.
The resulting plunge in economic growth rates essentially ‘stalled’ the US economy into recession in 2001, despite the Fed’s vigorous attempts to cut rates again in order to prevent this.
The rebound that was to ultimately follow the 2001 recession had already started to run out of steam by 2003 (being constrained by perceived limits to money/debt creation).
However, at precisely this point, the Fed embarked on a multi-year programme of interest rate increases that exacerbated this trend and precipitated the onset of the Global Financial Crisis (GFC) or 2008-9 and accompanying recession, which once again occurred despite an extremely aggressive programme of rate cuts.
In 2017, the Fed again started to hike rates. On this occasion that acted more to undermine GDP growth rates by acting as a ceiling rather than an immediate instigator of collapse. Once again, when GDP growth plunged, the Fed cut rates but was unable to prevent recession in 2020.
The latest round of monetary policy looks alarmingly like that of 1999 and 2003.
Rate hikes seem to have coincided almost precisely with the point at which GDP growth peaked.
However, in 2003, the rate of slowdown was much less marked than in 1999 or since 2021.
If history is any kind of guide, then, just like in 1999 the FFR has been set much too high, for much too long and at exactly the wrong time. History suggests that it is already too late for rate cuts to prevent a recession.
To counteract the adverse consequences of ‘too high for too long’ history suggests that the Fed would need to cut FRR to 1% - 1.25%.
History also suggests that eventually policymakers will take this kind of action but will be uncomfortable with such ‘low’ rates’ and would be inclined to want to ‘normalise’ monetary policy. History also suggests that while they might try to do so, they might not be able to do so in the short or medium term without once again bringing about a global financial crisis.
Therefore, while the US economy ostensibly grew by 4.9% in Q3, we remain extremely concerned about the outlook for economic growth, in USA and globally.
As in previous instances, FOMC reaction to inflation has been misguided. The Fed continues to assume that inflation is much higher than it really is (Professor Campbell Harvey who is widely regarded as the leading expert of the relationship between interest rates and economic performance, observed today that consumer price inflation is really running at around 1.8%. [2])
To compound this, the Fed appears to be overstating growth by using methods that historically have a bias to missing trend turning points when growth slows and also to using a GDP deflator that is currently overstating growth rates.[3]
On top of all this, even the Fed’s own Panglossian models are indicating that the economy is at stall speed and is slowing as can be sign in our final table below, the Fed’s live model of GDP forecasting . While this shares the Fed biases that that have historically, without exception overstated real GDP when the American economy has in reality been heading into slowdown and while it reflects the strong rebound in Q3, even this inhouse Fed model points to a much slower economy ahead:
Market forecasts are even more negative, seeing a sub-1% growth rate slow into a recession in 2024. [4]
In addition to the policy failings outlined above (which might in part be described as the Fed charting the wrong course because of their reliance on a broken compasses), our lack of reassurance about the ‘robust’ nature of Q3 GDP data also partly derives from the composition of the apparent sharp increase in economic activity.
Consumer spending rose by 4% in the period. However, as we’ve mentioned before (See Outlook October and Outlook September), personal savings have plunged. As we also warned would happen, aggregate wage growth has stalled. The expected consequence of these constraints is that consumption should fall sharply going forwards.
US Exports soared by 6.2% in Q3 but this is largely a base effect, following a fall of -9.3% in Q2.[5] Therefore, this should be seen as more of a one-off (although it may continue to Q4) than a sustainable trend.
The key question for the US and global economies in 2024 is no longer about whether a soft landing will be achieved,[6] but rather how hard will the landing be – mild and short recession or severe and prolonged. The longer that monetary and fiscal policy remains restrictive, the more the odds favour severe and prolonged, unless of course, the policy response is accommodatory that it echoes that of 2001, in which case, watch out for policymakers patting themselves on the back a in a few years’ time before tightening pre-emptively and bringing on GFC 2, the sequel.
This is far from being either certain or unavoidable.
However, in the prevailing policy environment, it is all too predictable.
I see them running with their tails hanging low
like dogs in the midwinter.
The prophets and the wise men and the hard politicos
Are all dogs in the midwinter.
Let the breath from the mountain still the pain,
Clear water from the fountain run sweeter than the rain.
Dogs
[1] https://economics.td.com/us-cpi-pce
[3] This phenomenon has been apparent for over a year now- https://economics.td.com/us-cpi-pce
[4] https://www.conference-board.org/research/us-forecast
[5] https://tradingeconomics.com/united-states/gdp-growth
[6] As we have mentioned before Senator Warren has pointed out that since WW2, the Fed has a 0% success rate in achieving soft landings with such policies, whereas PIMCO’s Tiffany Wilding more charitably describes their failure rate as 90%.


