Unspirational Speaking Part Two -
More thoughts from recent presentations.... (inflation and monetary policy mistakes)
As mentioned in Part One -
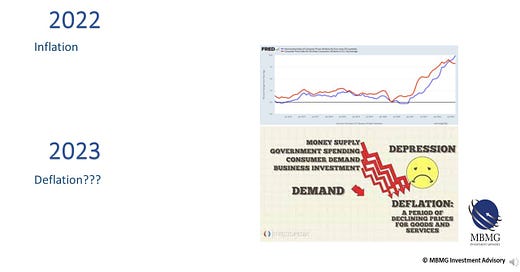
- we’re sending out more thoughts about 2022 as the year winds to some kind of conclusion, as well as our concerns about what lies ahead in 2023. Here is another slide and more thoughts from our recent presentations:
In 2022 aggregate demand generally remained well below capacity across most economic activities – in other words, there are sufficient, if not surplus resources to support the levels of aggregate global activity. This would usually be disinflationary, if not deflationary but has in fact seen a surge in consumer price inflation.
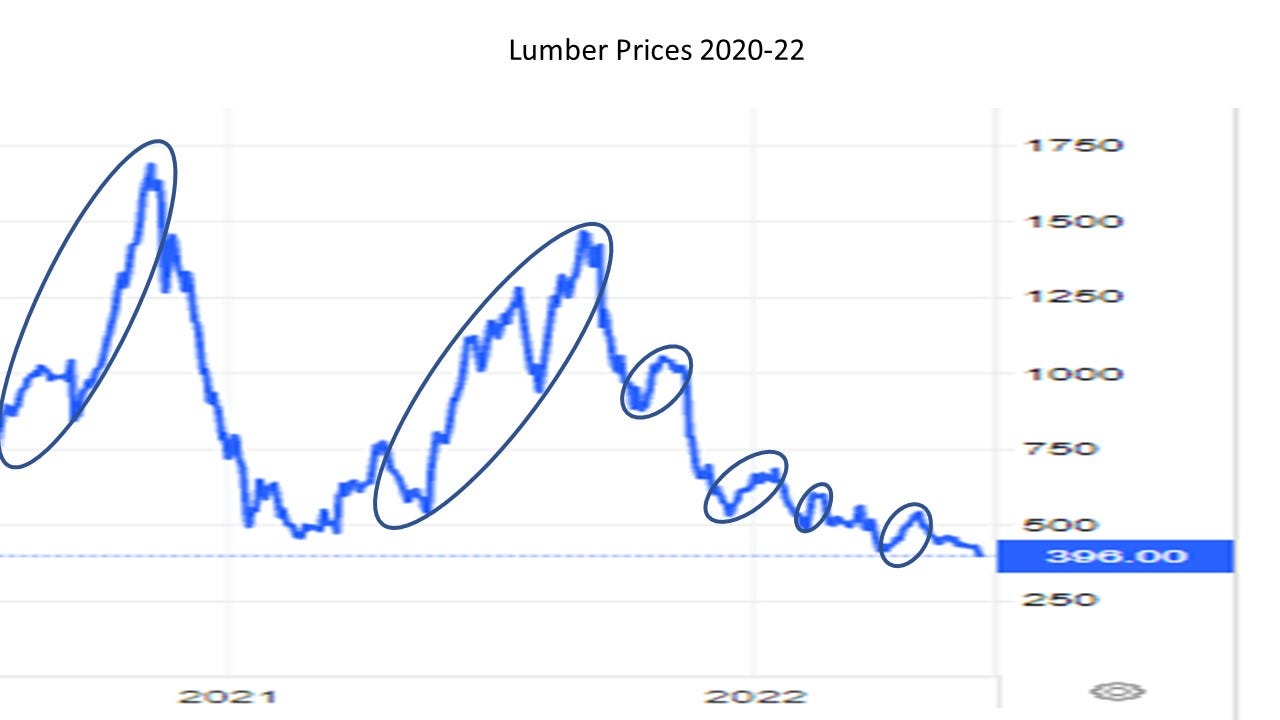
While the word transitory is midleading, we believe that there have been 3 successive waves of inflation, each of which has been driven by short-term causes. We now understand[1] what logistics experts have known for some time – namely that supply-side inflationary inputs tend to be a series of waves and that the automation of logistical processes, which made supply chains generally leaner and physical inventories typically lighter, may have exacerbated this by relying on finely tuned models that lack sufficient excess capacity to deal with the scale of demand variance experienced by the lockdown and subsequent re-opening of economies following the COVID pandemic. Typically these waves dissipate as demand resumes a more typical timescale and typical supply and demand aggregate factors, not distorted by compression of demand into shorter period, come back into play. We can see this in terms of the waves that saw the price of lumber collapse in Febrary 2020 from almost $500 per 1000 board feet, to just over $250 in April 2020 before spiking to over $1,700 just over a year later, and then retracing, rebounding and retracing in gradually smaller, smoother waves as demand and supply normalised, until it reached the current level of just below $400:
The journey may have been dramatic, but this argues for long-term lower, rather than higher, prices than pre-COVID.
In other words, while the aggregate volumes of lumber purchased and transported following the reopening in the second half of 2020 was well within the global economy’s long run capacity to supply and to ship, the concentration of this demand in a short period exceeded the ability of supply chains to do so.
As an extreme hypothetical example, imagine that demand for a good in 2020 fall by 25% compared to 2019 – you wouldn’t expect any difficulties obtaining that good and you wouldn’t expect the price to increase sharply because of scarcity. However, if production, consumption and transportation of that good in our hypothetical example fell to zero in the first 6 months of 2020, then assuming that demand pre-COVID was consistent throughout the year (i.e. wasn’t seasonal like pumpkins or Xmas trees), then the demand in the second half of the year represents an increase of 50% in the established, pre-pandemic production, distribution and transaction run rate:
In essence, the pricing outputs (inflation) reflect the supply chain’s inability to turn taps off and back on again sufficiently adroitly to cope with such wild, and in many people’ lifetimes (certainly in the era of automated lean manufacturing and lean logistics), unprecedentedly wild swings in demand. COVID lockdowns resulted in both the demand and the supply of our ‘hypo-widgets’ falling to zero in H1 20 but when demand increased to 75 in H2 20, supply chains designed to tolerate small variances above or below typical levels of demand were unable to keep up with such dramatic fluctuations in demand.
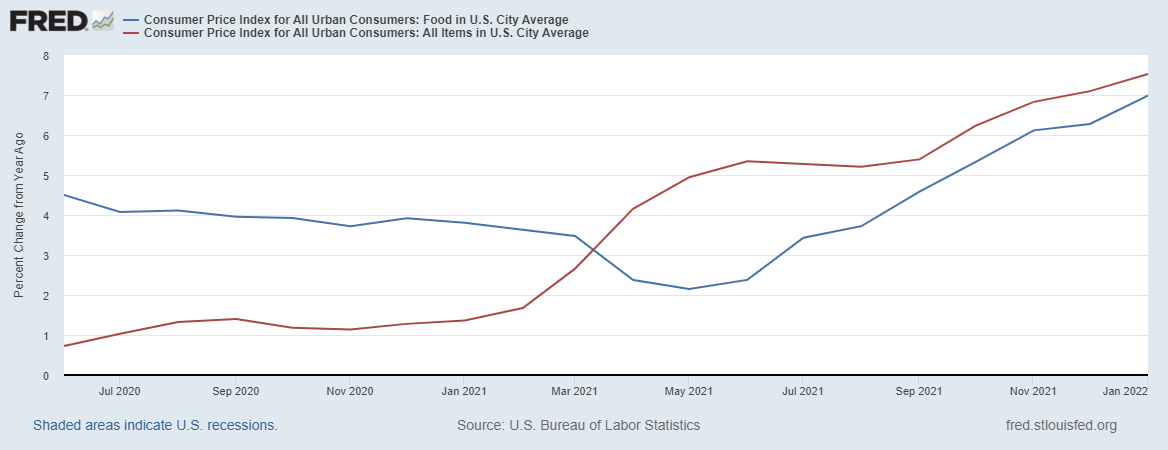
We see the effect starkly when we compare inflation rates on items of more constant consumptions (staples such as food):
Prior to COVID, the inflation rate on food and all items in urban USA had been a fairly consistent 2%. In the early phase of lockdown, when supply of food was disrupted but demand remained reasonably constant, food inflation increased to in excess of 4.5% by mid-2020 but demand for more discretionary spending reduced the overall inflation rate below 0.25%. However, the surge in discretionary spending in H2 2020 that continued into 2021 drove the broad inflation rate above 7% going into 2022.
In our next update, we’ll explain why this effect was more pronounced in economies where consumption was supported and encouraged by policy.
[1] https://www.researchgate.net/publication/241227306_Waves_beaches_breakwaters_and_rip_currents_-_A_three-dimensional_view_of_supply_chain_dynamics
MBMG Investment Advisory is licensed by the Securities and Exchange Commission of Thailand as an Investment Advisor under licence number Dor 06-0055-21.
For more information and to speak with our advisors, please contact us at info@mbmg-investment.com or call on +66 2 665 2534.
About the Author:
Paul Gambles is licensed by the SEC as both a Securities Fundamental Investment Analyst and an Investment planner.
Disclaimers:
1. While every effort has been made to ensure that the information contained herein is correct, MBMG Investment Advisory cannot be held responsible for any errors that may occur. The views of the contributors may not necessarily reflect the house view of MBMG Investment Advisory. Views and opinions expressed herein may change with market conditions and should not be used in isolation.
2. Please ensure you understand the nature of the products, return conditions and risks before making any investment decision.
3. An investment is not a deposit, it carries investment risk. Investors are encouraged to make an investment only when investing in such an asset corresponds with their own objectives and only after they have acknowledge all risks and have been informed that the return may be more or less than the initial sum.


